2024 GHG Emission Distribution
Analysis of Greenhouse Gas Emission Reporting and Registration Status for 2024 A total of 562 enterprises completed the Greenhouse Gas Emission Reporting and Registration for 2024. Analysis of the public information of the current situation of emission sources which completed the measurement, registration and verification processes indicated that the direct emissions was 210.9 million metric tons of CO2e and the indirect emissions was 53.1 million tons of CO2e.
2023 GHG Emission Distribution
Analysis of Greenhouse Gas Emission Reporting and Registration Status for 2023 A total of 553 enterprises completed the Greenhouse Gas Emission Reporting and Registration for 2023. Analysis of the public information of the current situation of emission sources which completed the measurement, registration and verification processes indicated that the direct emissions was 214.5 million metric tons of CO2e and the indirect emissions was 54.6 million tons of CO2e.
2022 GHG Emission Distribution
Analysis of Greenhouse Gas Emission Reporting and Registration Status for 2022 A total of 550 enterprises completed the Greenhouse Gas Emission Reporting and Registration for 2022. Analysis of the public information of the current situation of emission sources which completed the measurement, registration and verification processes indicated that the direct emissions was 223.2 million metric tons of CO2e and the indirect emissions was 56.9 million tons of CO2e.
2021 Direct Emission Distribution
Analysis of Greenhouse Gas Emission Reporting and Registration Status for 2021 A total of 289 enterprises completed the Greenhouse Gas Emission Reporting and Registration for 2021. Analysis of the public information of the current situation of emission sources which completed the measurement, registration and verification processes indicated that the direct emissions of this inaugural batch of emission sources was 233.90 million metric tons of CO2e. In terms of sectors, the power sector accounted for the largest emissions, with a cumulative total of about 127.20 million tons of CO2e, accounting for 54.30% of the total emissions, followed by the iron and steel sector (details as below).

Note: Current status of direct emissions from the inaugural batch of emission sources in 2021 (statistics as of December 31, 2022).
2020 Direct Emission Distribution
Analysis of Greenhouse Gas Emission Reporting and Registration Status for 2020 A total of 287 enterprises completed the Greenhouse Gas Emission Reporting and Registration for 2020. Analysis of the public information of the current situation of emission sources which completed the measurement, registration and verification processes indicated that the direct emissions of this inaugural batch of emission sources was 222.77 million metric tons of CO2e. In terms of sectors, the power sector accounted for the largest emissions, with a cumulative total of about 122.45 million tons of CO2e, accounting for 54.97% of the total emissions, followed by the iron and steel sector (details as below).
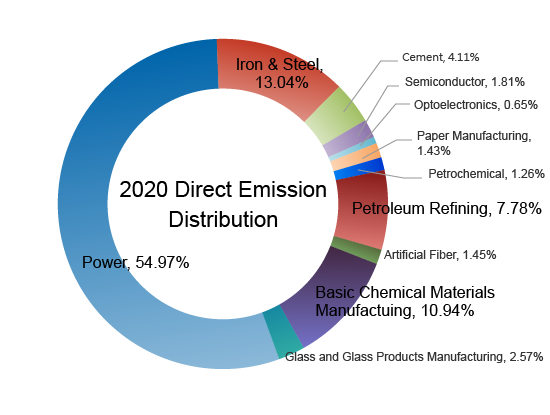
Note: Current status of direct emissions from the inaugural batch of emission sources in 2020 (statistics as of December 31, 2021).
2019 Direct Emission Distribution
Analysis of Greenhouse Gas Emission Reporting and Registration Status for 2019 A total of 288 enterprises completed the Greenhouse Gas Emission Reporting and Registration for 2019. Analysis of the public information of the current situation of emission sources which completed the measurement, registration and verification processes indicated that the direct emissions of this inaugural batch of emission sources was 224.9 million metric tons of CO2e. In terms of sectors, the power sector accounted for the largest emissions, with a cumulative total of about 119.53 million tons of CO2e, accounting for 53.15% of the total emissions, followed by the iron and steel sector (details as below).

Note: Current status of direct emissions from the inaugural batch of emission sources in 2019 (statistics as of December 31, 2020).
2018 Direct Emission Distribution
Analysis of Greenhouse Gas Emission Reporting and Registration Status for 2018 A total of 293 enterprises completed the Greenhouse Gas Emission Reporting and Registration for 2018. Analysis of the public information of the current situation of emission sources which completed the measurement, registration and verification processes indicated that the direct emissions of this inaugural batch of emission sources was 235.67 million metric tons of CO2e. In terms of sectors, the power sector accounted for the largest emissions, with a cumulative total of about 126.09 million tons of CO2e, accounting for 53.51% of the total emissions, followed by the iron and steel sector (details as below).

Note: Current status of direct emissions from the inaugural batch of emission sources in 2018 (statistics as of December 31, 2019).
Note: The number of enterprises that authorized to declare is 294 enterprises. 1 enterprise in Taoyuan City abolished the factory registration on June 12, 2019. The total number of declarants is 293.
2017 Direct Emission Distribution
Analysis of Greenhouse Gas Emission Reporting and Registration Status for 2017 A total of 287 enterprises completed the Greenhouse Gas Emission Reporting and Registration for 2017. Analysis of the public information of the current situation of emission sources which completed the measurement, registration and verification processes indicated that the direct emissions of this inaugural batch of emission sources was 236.42 million metric tons of CO2e. In terms of sectors, the power sector accounted for the largest emissions, with a cumulative total of about 130.27 million tons of CO2e, accounting for 55.10% of the total emissions, followed by the iron and steel sector (details as below).
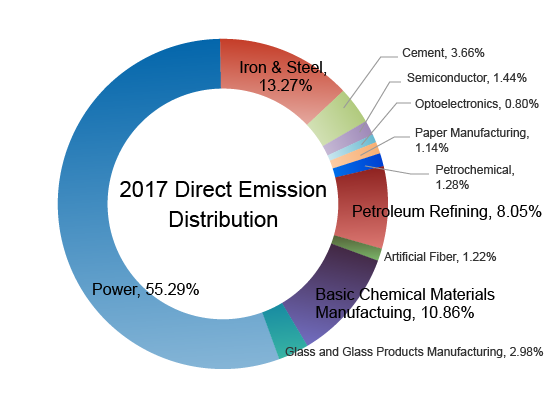
Note: Current status of direct emissions from the inaugural batch of emission sources in 2017 (statistics as of December 31, 2018).
2016 Direct Emission Distribution
Analysis of Greenhouse Gas Emission Reporting and Registration Status for 2016 A total of 280 enterprises completed the Greenhouse Gas Emission Reporting and Registration for 2016. Analysis of the public information of the current situation of emission sources which completed the measurement, registration and verification processes indicated that the direct emissions of this inaugural batch of emission sources was 230.22 million metric tons of CO2e. In terms of sectors, the power sector accounted for the largest emissions, with a cumulative total of about 120.54 million tons of CO2e, accounting for 52.36% of the total emissions, followed by the iron and steel sector (details as below).

Note: Current status of direct emissions from the inaugural batch of emission sources in 2016 (statistics as of December 31, 2017).
2015 Direct Emission Distribution
Analysis of Greenhouse Gas Emission Reporting and Registration Status for 2015 A total of 285 enterprises completed the Greenhouse Gas Emission Reporting and Registration for 2015. Analysis of the public information of the current situation of emission sources which completed the measurement, registration and verification processes indicated that the direct emissions of this inaugural batch of emission sources was 226.90 million metric tons of CO2e. In terms of sectors, the power sector accounted for the largest emissions, with a cumulative total of about 115.39 million tons of CO2e, accounting for 50.85% of the total emissions, followed by the iron and steel sector (details as below).
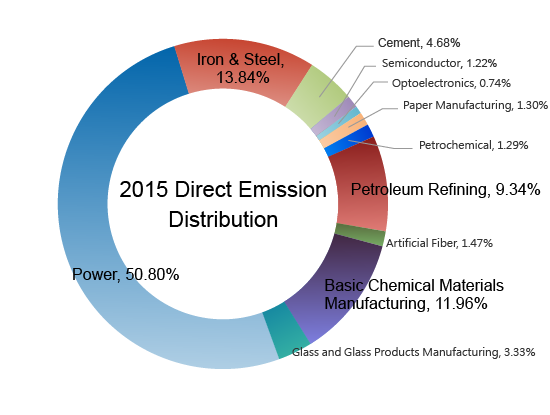
Note: Current status of direct emissions from the inaugural batch of emission sources in 2015 (statistics as of December 31, 2016).